

How Well Do Voters Know the Big Beautiful Bill?
And will it help or hurt them?

“So many false statements are being made about ‘THE ONE, BIG, BEAUTIFUL BILL,’” President Trump wrote on Truth Social yesterday, referring to the House-passed package containing many of his top legislative priorities.
And he’s right! There’s a lot of misinformation floating around about the bill. But then Trump went on to make two false statements himself: “What nobody understands is that it’s the single biggest Spending Cut in History, by far! But there will be NO CUTS to Social Security, Medicare, or Medicaid,” he wrote, adding: “The only ‘cutting’ we will do is for Waste, Fraud, and Abuse.”
To take those claims in order:
1) This package cuts about $1.5 trillion in government spending over the next 10 years, which does make it one of the largest spending cuts in history — but not the largest (and, therefore, obviously not the largest “by far”).
According to the non-partisan Committee for a Responsible Federal Budget (CRFB), the GOP package is second place in terms of amount of spending cut in recent history (behind the Budget Control Act of 2011, which cut $2 trillion) and third place in terms of spending cut relative to the size of the economy at the time (with spending cuts equivalent to 0.5% of current GDP — behind the 2011 law, which cut 1% of GDP at the time, and the Omnibus Budget Reconciliation Act of 1990, which cut 0.8% of GDP at the time).1
2) The package would not cut Social Security or Medicare, but it would reduce federal spending on Medicaid by about $600 billion over the next 10 years, according to the non-partisan Congressional Budget Office (CBO). As the New York Times notes, most of the changes to Medicaid would not cut “waste, fraud, and abuse,” at least in terms of how those categories are defined by the federal government.
Instead, as the Times notes, the spending would be reduced by “targeting Medicaid expansion, limiting states’ ability to finance Medicaid, imposing red tape on beneficiaries, rolling back protections against medical debt, forcing states to drop coverage, and limiting access to care and long-term care.” The CBO estimates that these changes will lead to 10.3 million people losing their Medicaid coverage over the next decade.
Is there anything else that Americans — maybe even you! — are getting wrong about the One Big Beautiful Bill? To find out, let’s go to a recent poll by YouGov and The Economist, which asked a series of questions about voters think about the package. Then, we’ll compare their answers to reality.
The package does not raise anyone’s taxes
One of the most striking findings in the poll, also noted by Substacker Galen Druke, is that 40% of Americans think their taxes will go up under the One Big Beautiful Bill. This includes 39% of people making under $50,000 a year, 42% of people making between $50,000 and $100,000 a year, and 38% of people making more than $100,000 a year.
The reality is that none of these groups will see their tax bills increase if the package is enacted.
That’s according to both the right-leaning Tax Foundation and the left-leaning Center on Budget and Policy Priorities (CBPP). If you take just the tax portions of the package into account, the Tax Foundation estimates that after-tax income would increase by 2.1% for the poorest 20% of Americans under the bill, by 4.2% for the richest 20%, and by 4.4%.-4.6% for everyone in between.
The CBPP, meanwhile, estimates that the tax provisions alone (not taking anything else from the package into consideration) would increase after-tax income by 0.6% for the poorest 20%, by 4.2% for the richest 10%, and by 1.5%-2.9% for everyone in between.2
Unsurprisingly, considering their ideological bents, these organizations take slightly different views of how the package will impact different groups of people, but the headline takeaway for our purposes is that no group will be paying more in taxes if the package is enacted, which is notable since 4-in-10 Americans think they will be.
It does not appear that the misperceptions on this score vary based on economic status: for group across the income scale, about 40% think their taxes will go up under the package, from the poorest to the wealthiest Americans. Instead, the variance is by party. 64% of Democrats and Democratic-leaning Independents think their tax bill will increase, compared to only 18% of Republicans and Republican-leaning Independents.
The package’s overall impact will help the wealthiest and hurt the poorest
But the One Big Beautiful Bill is more than just a tax bill, of course. As noted, it also makes changes to Medicaid, as well as other social safety net programs like food stamps. So, if you’re calculating the overall impact of the package, you need to look at the whole thing, not just taxes.
When you ask Americans to guess how the package will impact them, you get roughly similar numbers. 20% think the bill will help them, 40% think the bill will hurt them, and 21% think the package won’t have much of an impact on them. (19% are not sure.)
There is some variance by income level, but not much (<$50K: 18% say the package will help them, 45% say it will hurt them; $50K-$100K: 20% say help, 40% say hurt; $100K+: 26% say help, 37% say hurt). Once again, the biggest split is by party (3% of Democrats say the package will help them, 72% say it will hurt; 44% of Republicans say the package will help them, 9% say it will hurt).
In reality, the package does not discriminate by party; its impact will, however, vary by income level.
Here, we’ll use estimates by the University of Pennsylvania’s Penn Wharton Budget Model (PWBM), a non-partisan outfit that is often cited by both Democrats and Republicans. According to the PWBM, if you take everything from the bill into account — the tax and spending changes — average after-tax income is projected to decline for the poorest 40% of Americans and increase for the richest 60%.
That’s using conventional metrics. The PWBM also uses dynamic distributional analysis, which is the standard in academic research, to try to project how much better or worse off, on average, each age and income group will be because of a policy change over their entire lifetime. (They also include children who aren’t yet born, but will one day be impacted by the package’s policies, which is represented by the negative age categories below.)
Here’s a look at that breakdown:
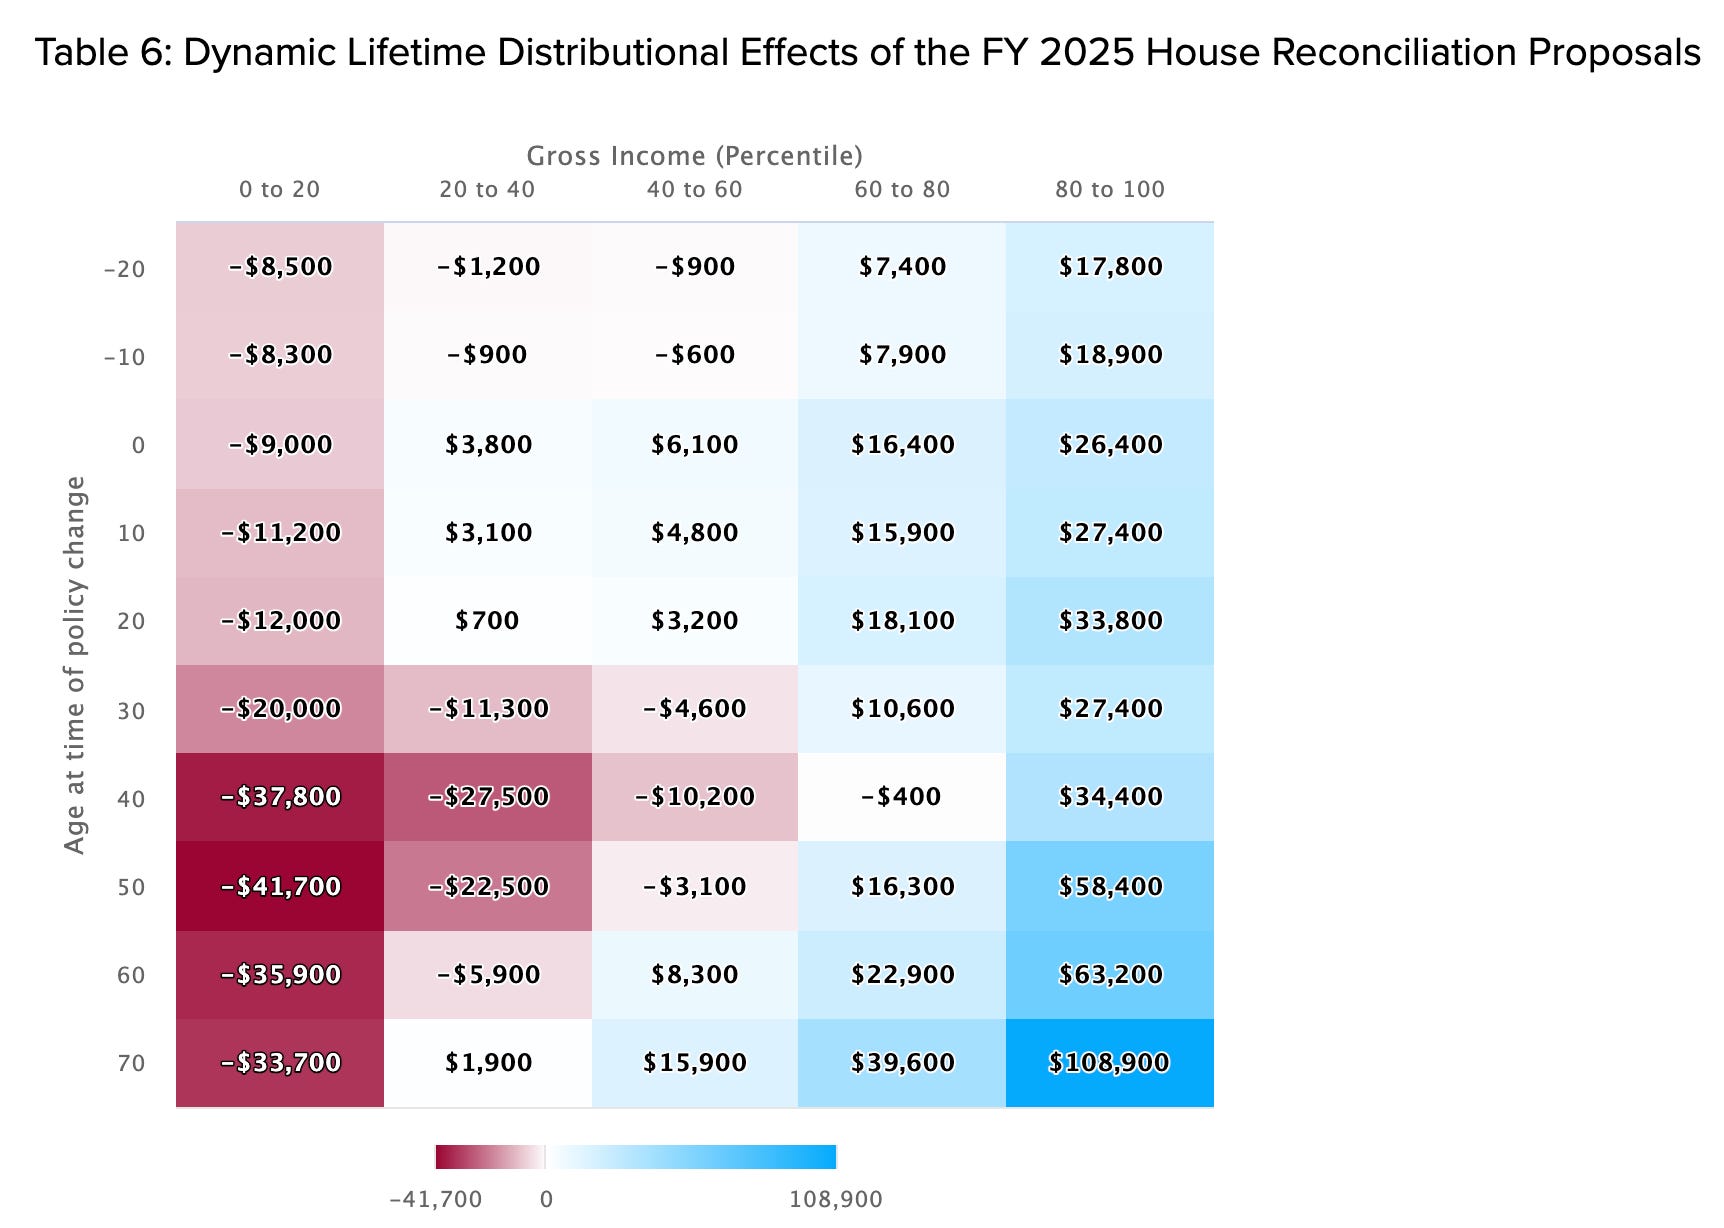
For the average 40-year-old in the poorest 20% of Americans, for example, this chart says that the GOP package is equivalent to losing $37,800 over their lifetime. For the average 40-year-old in the richest 20% of the country, the package is the equivalent to gaining $34,400 over their lifetime.
Overall, as you can see, the wealthiest 40% of Americans (the top two quintiles) will benefit from the package no matter their age. The poorest 20% of Americans (the lowest quintile) will be hurt by it no matter their age. In the second and third quintile, the lifetime impact is negative for those currently in their 30s, 40s, and 50s, but jumps around a bit at other ages.
The package will add to the deficit
Finally, the poll asked Americans about the deficit impact of the Big Beautiful Bill. (As a reminder, the federal deficit is the annual difference between how much money the government spends and how much money it takes in through taxes.) 37% said the deficit would increase because of the package, 21% said it would decrease, 16% said it will remain about the same, and 26% said they weren’t sure.
If your answer aligned with the 37%, you’d be correct.
As we’ve already covered, the package would cut a large amount of spending, while also cutting everyone’s taxes (though by varying amounts). If the amount the government would no longer be spending under the package was equal to the amount of lost tax revenue under the package, its deficit impact would be zero. If the amount of reduced spending was greater than the amount of reduced revenue, then the package would reduce the deficit.
But, instead, the amount of reduced revenue stemming from the package’s tax cuts is much greater than the amount of spending the package cuts, according to every independent analysis of the bill.
The Penn Wharton Budget Model says that the package would increase the deficit by $2.8 trillion over 10 years. The Congressional Budget Office says the bill would increase the deficit by $2.3 trillion over 10 years. The Yale Budget Lab says the bill would increase the deficit by $2.4 trillion over 10 years.
The spending cuts in the package do not come close to offsetting the loss in government revenue.
It’s also worth noting, as the CRFB does, that the overall impact of the 2011 and 1990 packages was to cut the deficit. As we’ll discuss, the $1.5 trillion in spending cuts in the One Big Beautiful Bill — while meaningful — are offset (and then some) by the tax cuts in the bill, which means the overall impact of the package adds to the deficit, unlike those earlier spending-cut packages.
Note: The Tax Foundation projection is for 2026, while the CBPP projection is for 2027.
I have no doubts that this article is correct. But, I get the feeling that when people were asked if this bill would increase their taxes, they interpreted the question as "will the stuff Trump is doing increase my taxes (and lower my standard of living)." And to this question, the answer, especially for the people who are in average or lower tax brackets, is 'yes.'
It's very difficult to run a poll about one specialized thing in a vacuum.
“The CBPP, meanwhile, estimates would increase after-tax income by 0.6% for the poorest 20%,”. The reason this percentage is so low is that this demographic pays NO federal income taxes. Hard to increase something that doesn’t exist. The top 50% earners pay 97% of all taxes collected. The bottom 50% of earners pay 3%. How can you provide more tax cuts for a group that pays no tax now?